Testing and experiments
How to read Google Ads experiment results
Reviewed September 2026 · All guides
To read a Google Ads experiment result, open the experiment, set the date range to exclude the warm-up weeks, and look at the metric you picked before launch, usually CPA or ROAS. The scorecard shows the trial's difference against the base as a percentage with a confidence interval. If the whole interval sits on one side of zero and the scorecard marks the result as statistically significant, the trial differs from the base on that metric. If the interval crosses zero, you do not know yet, however large the headline percentage looks.
Most misreadings come from three habits: reading the percentage without the interval, judging on the metric that moved rather than the one that matters, and treating an inconclusive test as a loss for the trial.
What the scorecard shows
Open Campaigns > Experiments and click the experiment's name. The top of the page is the scorecard: one tile per metric, led by the two success metrics you picked at setup, each showing the trial's difference against the base campaign as a percentage. Under or beside each percentage sits a confidence interval, written as a range such as [-4%, +19%]; hover over the value to see it spelled out. A blue asterisk marks a difference that is statistically significant at the confidence level selected for the scorecard.
Below the scorecard is a table with both arms' raw numbers over the same date range: impressions, clicks, cost, conversions, conversion value and the ratios built from them. Always read the raw rows too. A +25% conversion rate on 12 conversions against 10 is a small-sample artefact, and the table shows that where the tile does not.
Set the date range before you read anything. The default covers the whole experiment, including the first week or two, when a trial with a new bid strategy is still in its learning period. Start the range after warm-up, and end it a few days before today if your conversions lag behind the click.
Confidence intervals, in practice
Say the scorecard shows Cost / conv. at -11% with an interval of [-19%, -3%]. The best single estimate is an 11% lower CPA in the trial, and at the confidence level shown, the true difference lies somewhere between 19% lower and 3% lower. The whole interval is below zero, so the trial is cheaper per conversion. On a campaign spending EUR 40,000 a month at a EUR 50 CPA, the conservative end of that range is EUR 48.50, the optimistic end EUR 40.50.
Now say it shows -11% with [-24%, +2%]. Same point estimate, but the interval includes zero and a small increase. You cannot tell the trial from the base yet. The headline number is identical in both cases; only the interval separates a result from a guess.
Width matters as much as position. An interval of [-2%, +40%] crosses zero, but it tells you the trial is unlikely to be much worse and could be much better. That is a case for running longer. An interval of [-3%, +3%] crosses zero and tells you the change does close to nothing. That is a case for stopping and testing something bolder.
Directional vs statistically significant
Google lets you choose the confidence level the scorecard uses: 80%, 85% or 95%, and some experiment types add 70%. Check which one your scorecard is set to before you read it: Google's help describes 80% as the default, and it describes 80% and 70% as directional and 95% as conclusive. At 95%, a result marked significant is one you can apply with reasonable confidence. At a directional level, the marker appears sooner, on less data, and with a higher chance that the difference is noise.
Directional results are useful for two decisions: whether to keep a test running, and what to test next. They are a weak basis for applying a change to a campaign that spends real money, because at 80% confidence roughly one in five of the "wins" you apply over time will be noise. If a directional result is the best you can get at your volume, apply only changes that are cheap to reverse, and keep watching the campaign afterwards.
Which metric to judge on
Judge on the metric the campaign is paid to move, and pick it before launch. For a lead generation campaign on Target CPA or Maximize conversions, that is Cost / conv. or Conversions at a stable cost. For e-commerce on Target ROAS or Maximize conversion value, it is Conv. value / cost or conversion value at a stable cost.
- CTR moves first and moves most, which makes it tempting. A trial with a higher CTR and a higher CPA lost. Use CTR to diagnose an ad copy test and decide on cost.
- Cost and clicks can differ between arms when the trial changes bidding. A trial that spends 20% more at the same CPA bought more conversions; decide whether you wanted them.
- Conversion rate ignores cost. A trial that converts better on much more expensive clicks can still lose on CPA.
- For ROAS tests, check conversions as well as value. A ROAS gain from two unusually large orders in one arm will not repeat.
If your success metric was significant and a secondary metric moved the wrong way, weigh both in money. A 12% lower CPA with 5% fewer conversions is a trade-off, and whether you take it depends on whether the campaign is limited by budget or by demand. How to lower CPA without cutting volume covers that trade in more depth.
Novelty effects and fading wins
New ads, new landing pages and new offers often perform best in their first weeks: returning users notice them, and Smart Bidding explores more while it learns. Before you apply a winner, look at the result week by week. Change the scorecard's date range to each week in turn, or segment the table by week. A trial whose lead was 25% in week two and 6% in week five is converging on the smaller number.
With cookie-based splits the effect is stronger, because returning users see the same new version every time and the novelty wears off at a measurable rate. If the lead is shrinking and the interval is widening toward zero, extend the test rather than applying on the early numbers.
What to do with an inconclusive result
Most experiments end inconclusive. That is information: at your volume, the change does not move the metric by as much as you could detect. Three options, in order of preference:
- If the interval is wide and leans positive, extend the end date. Check first how much longer it needs; how long an experiment should run walks through the arithmetic.
- If the interval is narrow around zero, end it and keep the base. The change is not worth the risk of applying, and the time is better spent on a bolder test.
- If the change has a benefit outside the metric, such as cleaner structure, a simpler bid strategy, or copy that matches a new offer, you can apply it knowing it is roughly neutral on performance. Note it in your log as neutral rather than as a win.
Do not rerun the same test hoping for a different answer. Rerunning until one run shows significance is the same error as stopping on the first good day.
Where GoodLads fits
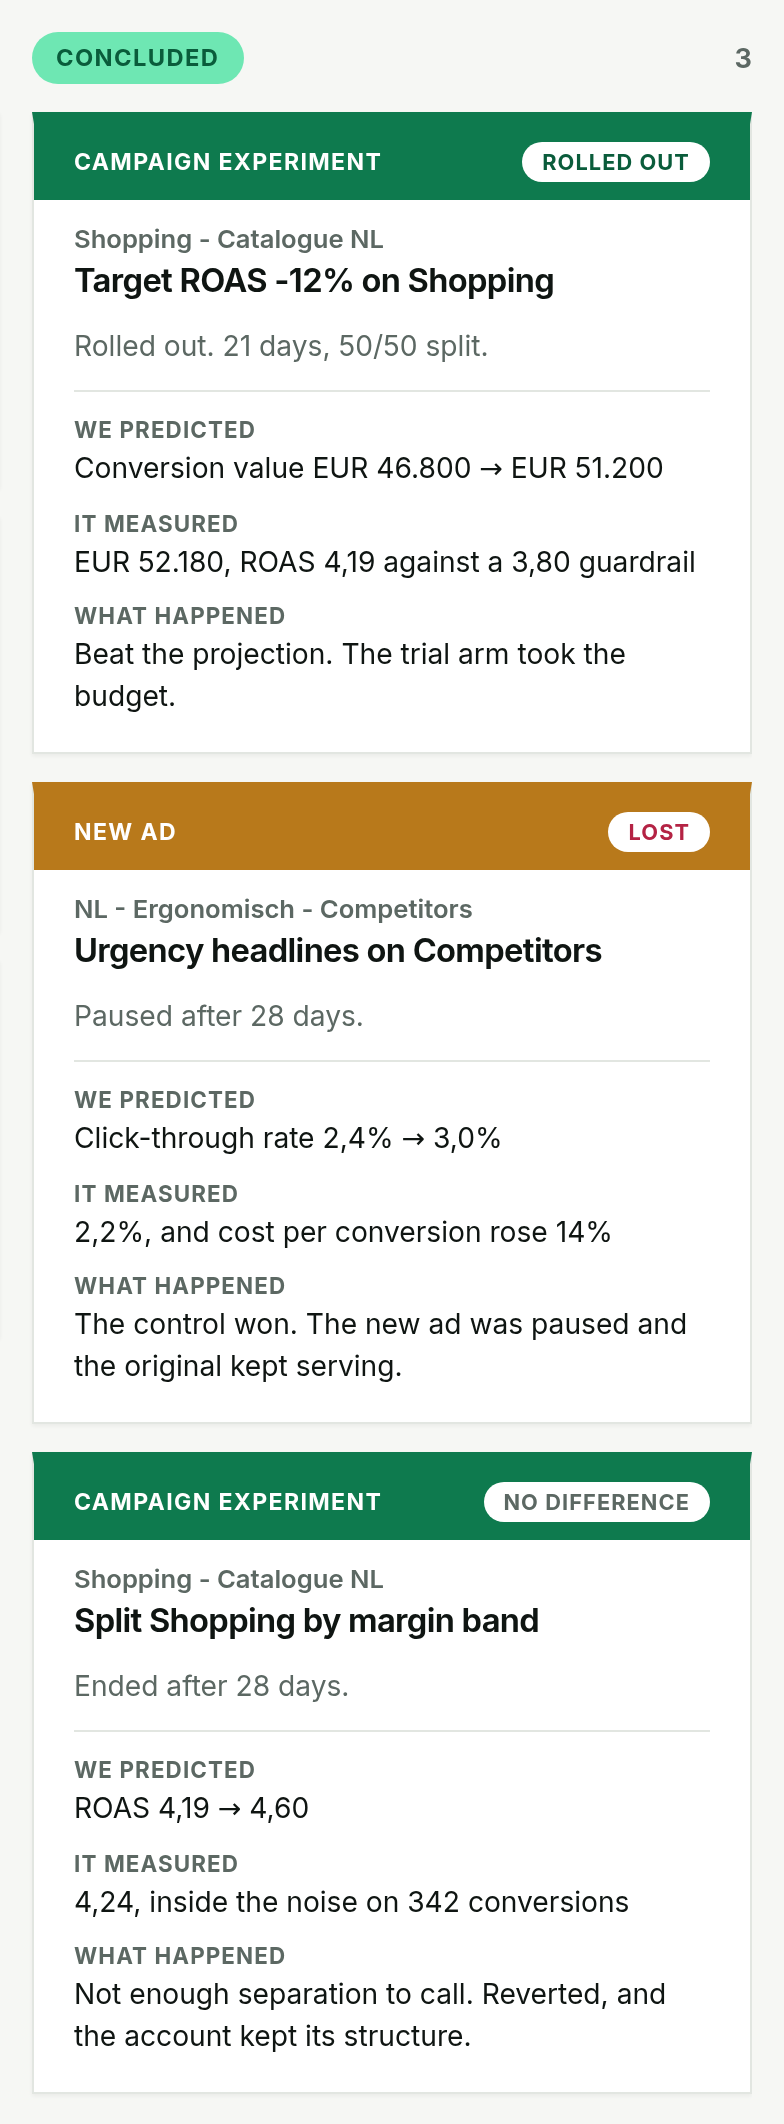
GoodLads puts every hypothesis it applies on a board and carries it to a verdict: working, underperforming, or still collecting data. An experiment Google does not mark significant is never counted as working, and the demo shows a win, a loss and a result with no difference on a worked account. You can also point Claude or ChatGPT at your own campaign data through the read-only MCP endpoint and ask it to walk through a result with you.
It does not replace the scorecard. Google's experiment reporting is the source of the numbers, and the judgement calls in this guide, such as which metric decides and whether to extend, stay with you.
Questions people ask
What does the confidence interval mean in Google Ads experiments?
It is the range the true difference between trial and base most likely falls in, at the confidence level shown. If the whole range is on one side of zero, the difference is significant; if it crosses zero, the result is inconclusive.
What is a directional result in Google Ads experiments?
A result judged at a lower confidence threshold than 95%, such as 80%. It appears sooner on less data and is more often noise, so treat it as a reason to keep testing rather than to apply.
Should I judge a Google Ads experiment on CTR or CPA?
On CPA or ROAS, whichever the campaign is paid to move. CTR is a useful diagnostic for ad copy but a trial with higher CTR and higher CPA lost.
What should I do if my Google Ads experiment is not significant?
Extend it if the interval is wide and leans positive, end it and keep the base if the interval is narrow around zero, and log the result either way.